L1
Common question
Every site answers the same research question, but analyzes it according to its own understanding of the data and methods. Greatest flexibility — and the greatest variation in implementation.
The complete path from a research question to decision-grade evidence — standardized, distributed and reproducible.
The pipeline
Steps 1–6 cover technical preparation and study execution; steps 7–8 focus on evidence communication. When a study uses a common protocol rather than a full CDM approach, the extent of data conversion can be adjusted — but common definitions and quality standards are always maintained.
The distributed data network
Raw data stay behind each site's firewall; every site analyzes locally and shares only permitted aggregate results. What varies is how much is shared consistently across sites.
Every site answers the same research question, but analyzes it according to its own understanding of the data and methods. Greatest flexibility — and the greatest variation in implementation.
Design, eligibility criteria, variable definitions and statistical methods are specified in advance; each site writes its own programs. The research logic is standardized — but the same written instructions can still be interpreted differently.
Each site first transforms its data into a consistent structure, then executes the same programs from the coordinating center. Implementation differences are minimized and analytical modules become reusable. This is IMPRESIVE's core.
Why a common protocol alone is not enough. In a published reproducibility study, 54 researchers in nine teams were asked to reconstruct the same study population from the same dataset, article and supplementary materials — in parallel with the original authors. The eligible populations they identified differed substantially and did not fully overlap. Even with identical data and descriptions, eligibility criteria, time windows, variables and programming logic are interpreted differently. Standardizing the data structure and the analytical code — not just the protocol — is how IMPRESIVE reduces irreproducibility caused by human interpretation.
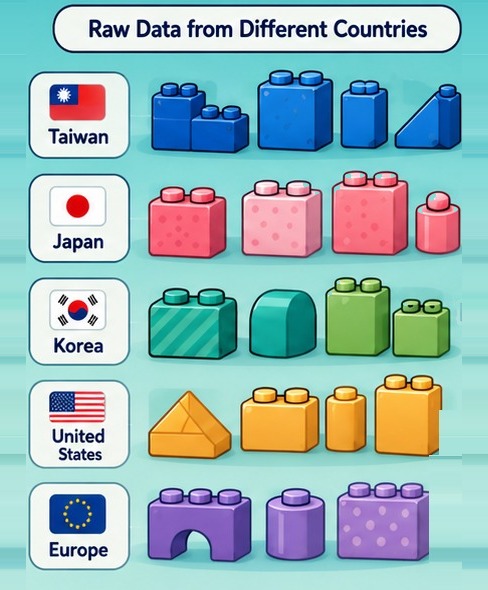
Different bricks, different countries
Every partner country brings its own set of bricks — different shapes, different colours. IMPRESIVE clicks them together into one shared build.
The common data model
Every country's data starts as differently shaped bricks. Standardization clicks them into one common data model — so they stack into a single, comparable build.
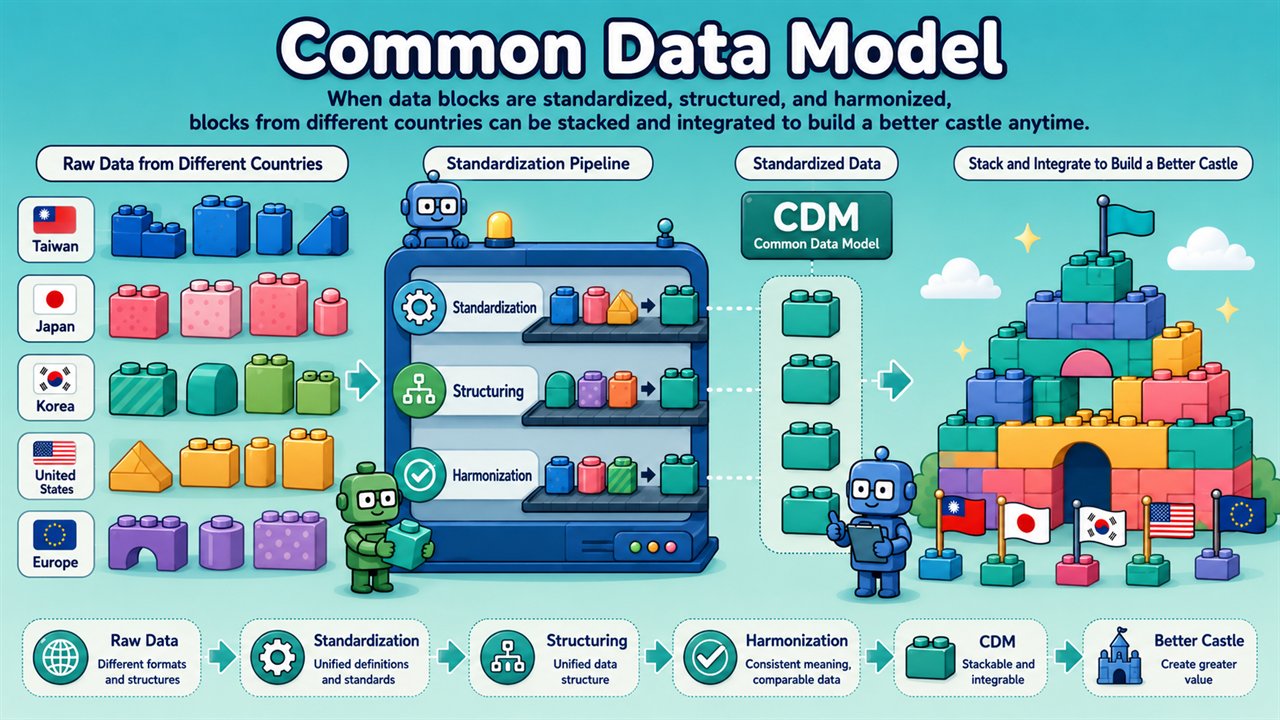
Each country brings claims or EHR data in different formats and code systems.
Variables, diagnoses and drugs mapped to shared definitions.
Reshaped into one common table structure.
The same meaning everywhere, so results are comparable.
One common data model a single analytic program can run on.
Countries stack into integrated, decision-ready evidence.
Practical experience
IMPRESIVE has implemented both. Neither is universally superior — the right choice depends on data governance, local coding systems, the research purpose and the team.
Taiwan's NHIRD sits in a highly controlled data center with no external access. The team first built dummy data with the same structure but no real personal information, developed and verified the transformation programs, vocabulary mappings and QA externally — then brought the validated programs into the data center for execution.
When the original Sentinel design could not fully represent drug-dose information needed for a study, the team added a documented, validated, version-controlled drug-dose table built on the concept of drug strength. Other local adaptations followed the same discipline: missing discharge dates derived from length of stay, and Taiwan NHI drug codes mapped through ATC for OMOP. Extending a model to meet a clinical question — with proper documentation — is itself a methodological contribution.
Getting the transformation right
The first step is not programming — it is understanding what each source database contains and which fields the intended study genuinely requires.
Each required element is classified before transformation: green — available and directly transformable; yellow — obtainable through derivation rules or additional processing; red — not directly available, requiring assumptions or unsupported. Temporal granularity matters too: monthly-level versus exact-date diagnoses directly change exposure windows and outcome ascertainment.
A detailed "transformation recipe" documenting how every source field converts to its target table and field — written before implementation in SAS, R or other local tools. It is a formal document supporting cross-country communication, reproducibility, updating and auditing — never undocumented knowledge held by one researcher.
Conformance — structures, formats and permitted values follow the CDM spec. Completeness — no information lost in transfer. Plausibility — dates, values and clinical distributions are reasonable and consistent with the source. For OMOP, the official Data Quality Dashboard runs 3,000+ automated checks; for the Sentinel-like CDM the team built its own quality checks, comparing native and CDM results with a 5% difference threshold.
Beyond field formats. The team also identifies study-relevant populations and compares annual and monthly patient and event counts between source and CDM. When something looks wrong, the cause is traced — shared analytical package, site-specific ETL program, execution inside the data center, or the source data itself — then revised and rerun in an iterative cycle. Anomalies that already exist in the source (for example, disease records inconsistent with recorded sex) are handled through case definitions and validation algorithms, not misclassified as ETL errors. CDM quality assurance ensures the transformation neither introduced nor lost information; the clinical plausibility of the source itself is a separate layer of data quality.
In depth
We help translate clinical, policy or industry problems into executable research questions. A topic well-suited to IMPRESIVE has:
Different national data structures are standardized to a common format and shared variable definitions so a single analytic program can run everywhere. This includes:
A common data model — OMOP, Sentinel-like or another standardized structure — lets different databases support multi-country analysis through one common analytical interface, while keeping local data governance fully intact. Quality validation covers structural conformance, plausibility, cohort and variable validation, and analytical consistency.
Reusable, standardized analysis modules:
Individual-level raw data never leaves each country's data center. What IMPRESIVE shares is the common protocol, standardized analytic code, data-quality diagnostic reports and aggregated statistical results.
Integration is more than a pooled estimate — it is understanding why results are the same, different, or not comparable across countries:
Visualization tools turn cross-national results into forms that are easy to understand and compare:
The goal is not analysis for its own sake, but support for decisions — integrating statistical results, method credibility, data fitness, clinical meaning and a decision recommendation.
"Evidence is not the end of analysis; it is the beginning of decision."